uniprof
uniprof simplifies CPU profiling for humans and AI agents.
Profile any application without code changes or added dependencies.
npx uniprof
~/src/app
❯uniprof python app.py
✓ Platform detected: python | Using profiler: py-spy | Mode: container
→ Starting profile (999 Hz sampling rate)
Profiling in progress
✓ Profiling completed successfully in 2.89s
Profile saved: profile.json (124.87 KB)
→ Top Functions by Time (1046 samples)
Showing functions with ≥0.1% of total time
FunctionSamplesTotal %TotalSelfp50p90p99Location
process 20:"python1046100.0%5.20s12.00ms4.00ms95.00ms220.00msapp.py:1
<module>104199.5%5.05s150.00ms3.50ms90.00ms180.00msapp.py:1
main95090.8%4.61s24.00ms3.80ms80.00ms160.00msapp.py:45
process_batch48546.4%2.87s2.30s14.00ms120.00ms260.00msapp.py:72
calculate_metrics31229.8%1.92s1.68s9.00ms140.00ms210.00msapp.py:89
parse_input15614.9%0.62s0.18s4.00ms55.00ms140.00msapp.py:23
Showing top 6 functions
CLI or MCP—your choice
Use uniprof directly from the command line, or add it to your AI agent as an MCP server.
# Install
$ npm install -g uniprof

# Get started
$ uniprof help
Agents, now with the power to fix slow code
Watch an agent use uniprof to identify the real performance bottleneck instead of guessing.
This example shows Claude Code debugging a real performance bottleneck in the Context app where MCP resources are slow to load. With access to the uniprof MCP, Claude Code is able to run Context, profile it, and : a syntax highlighting library that performs highlighting inside a JavaScript VM.
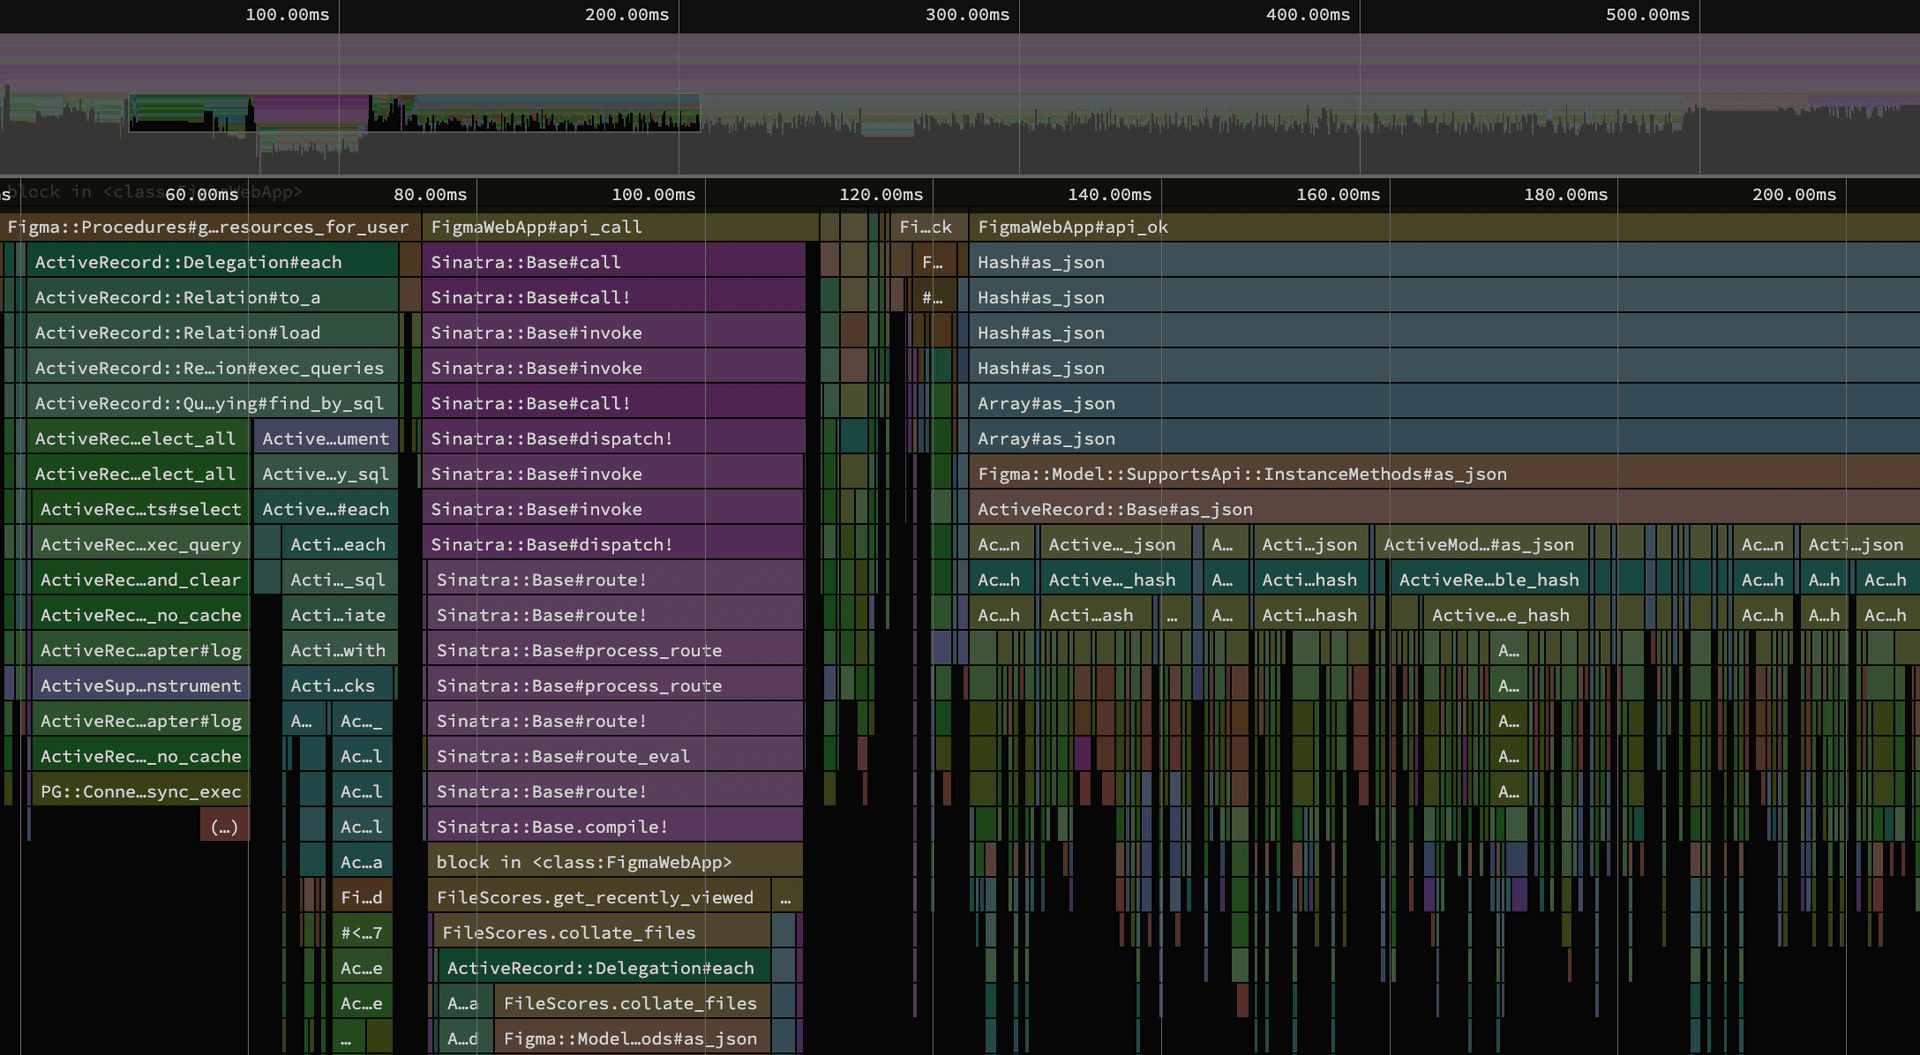
Built in visualization
uniprof includes built-in flamegraph visualization powered by speedscope.
~/src/app
❯uniprof --visualize ruby app.rb
✓ Server started on http://127.0.0.1:50496
✓ Browser opened!
Press Ctrl+C to stop the server
speedscope